Examples
Locust Telemetry supports two telemetry recorders:
JSON Telemetry Recorder — structured logs (Loki / Grafana Logs)
OpenTelemetry Metrics Recorder — metrics via OTLP (Prometheus / Grafana)
The recorder is selected using configuration or environment variables.
Note
Traces and spans are not yet emitted. Only metrics and events are supported. Trace support is planned and contributions are welcome. See Help Needed.
Local Setup
This example runs Locust with a full local observability stack using Docker:
Locust (master + workers)
OpenTelemetry Collector
Prometheus
Loki
Promtail
Grafana
Clone and Run
Clone the repository and start the stack:
git clone git@github.com:platform-crew/locust-telemetry.git
cd locust-telemetry/examples/local
make build && make up
This launches all required services and starts Locust in distributed mode.
Access the UIs
Locust Web UI:
http://localhost:8089Grafana:
http://localhost:3000(anonymous access enabled)
Run a Load Test
Open the Locust Web UI
Click Start (values are preconfigured)
Wait ~20 seconds for metrics and logs to appear
JSON Telemetry Recorder
The JSON recorder emits structured telemetry logs from Locust master and workers. These logs are shipped by Promtail and stored in Loki.
Recorder Configuration
Enable the JSON recorder using:
Environment variable:
LOCUST_ENABLE_TELEMETRY_RECORDER=jsonOr CLI flag:
--enable-telemetry-recorder json
Structured Log Fields
The following low-cardinality fields are recommended for indexing and dashboard filtering:
run_id — unique test run identifier
testplan — test plan name
recorder — master or worker
telemetry_type — event or metric
telemetry_name — metric or event name
Promtail Pipeline Example
Example Promtail configuration for parsing JSON telemetry logs:
pipeline_stages:
  - json:
      expressions:
        run_id: telemetry.run_id
        recorder: telemetry.recorder
        testplan: telemetry.testplan
        telemetry_type: telemetry.telemetry_type
        telemetry_name: telemetry.telemetry_name
        level: telemetry.level
        message: telemetry.message
        ts: telemetry.time

  - labels:
      run_id: run_id
      testplan: testplan
      recorder: recorder
      telemetry_type: telemetry_type
      telemetry_name: telemetry_name

  - match:
      selector: '{run_id=""}'
      action: drop

  - timestamp:
      source: ts
      format: RFC3339
Sample Dashboards (JSON)
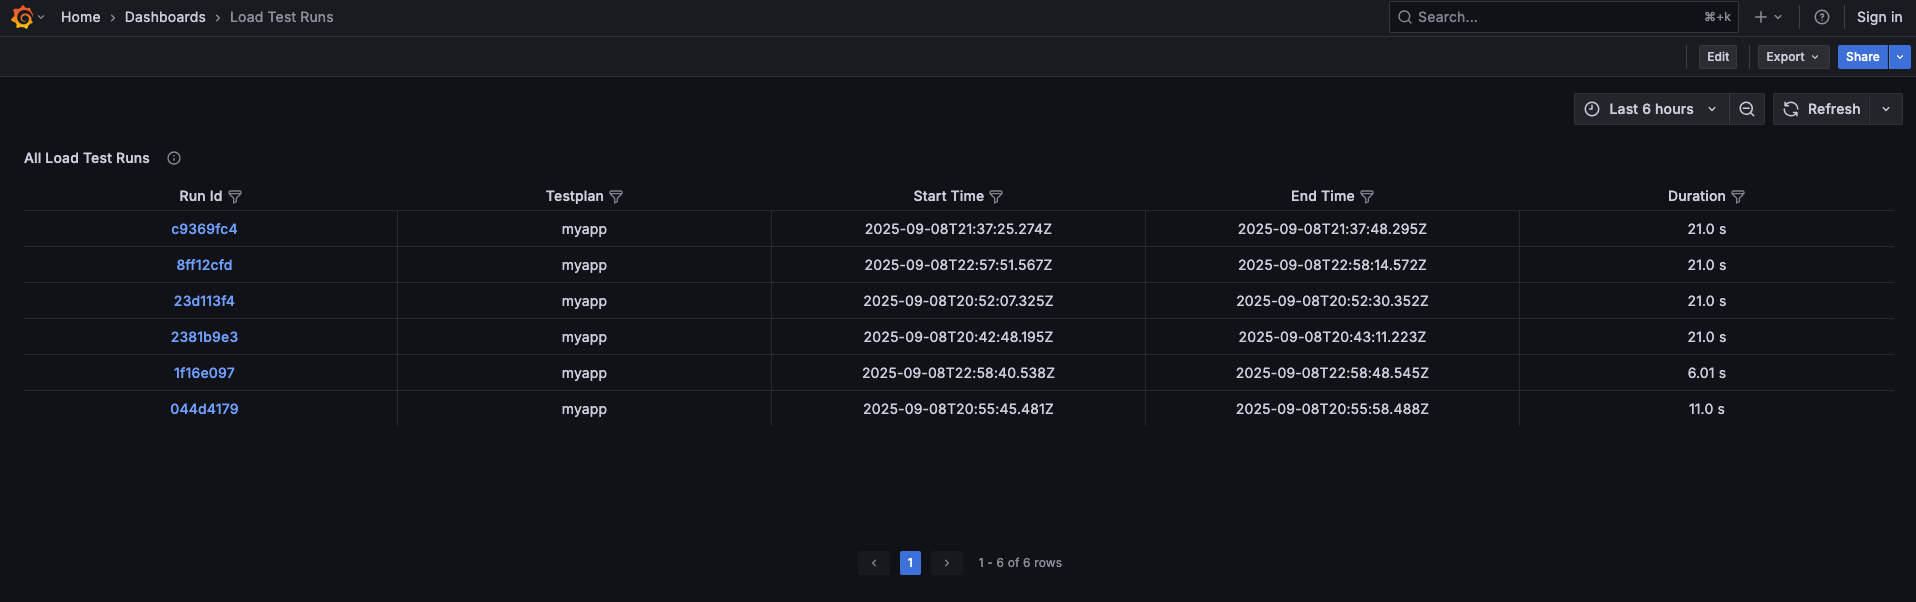
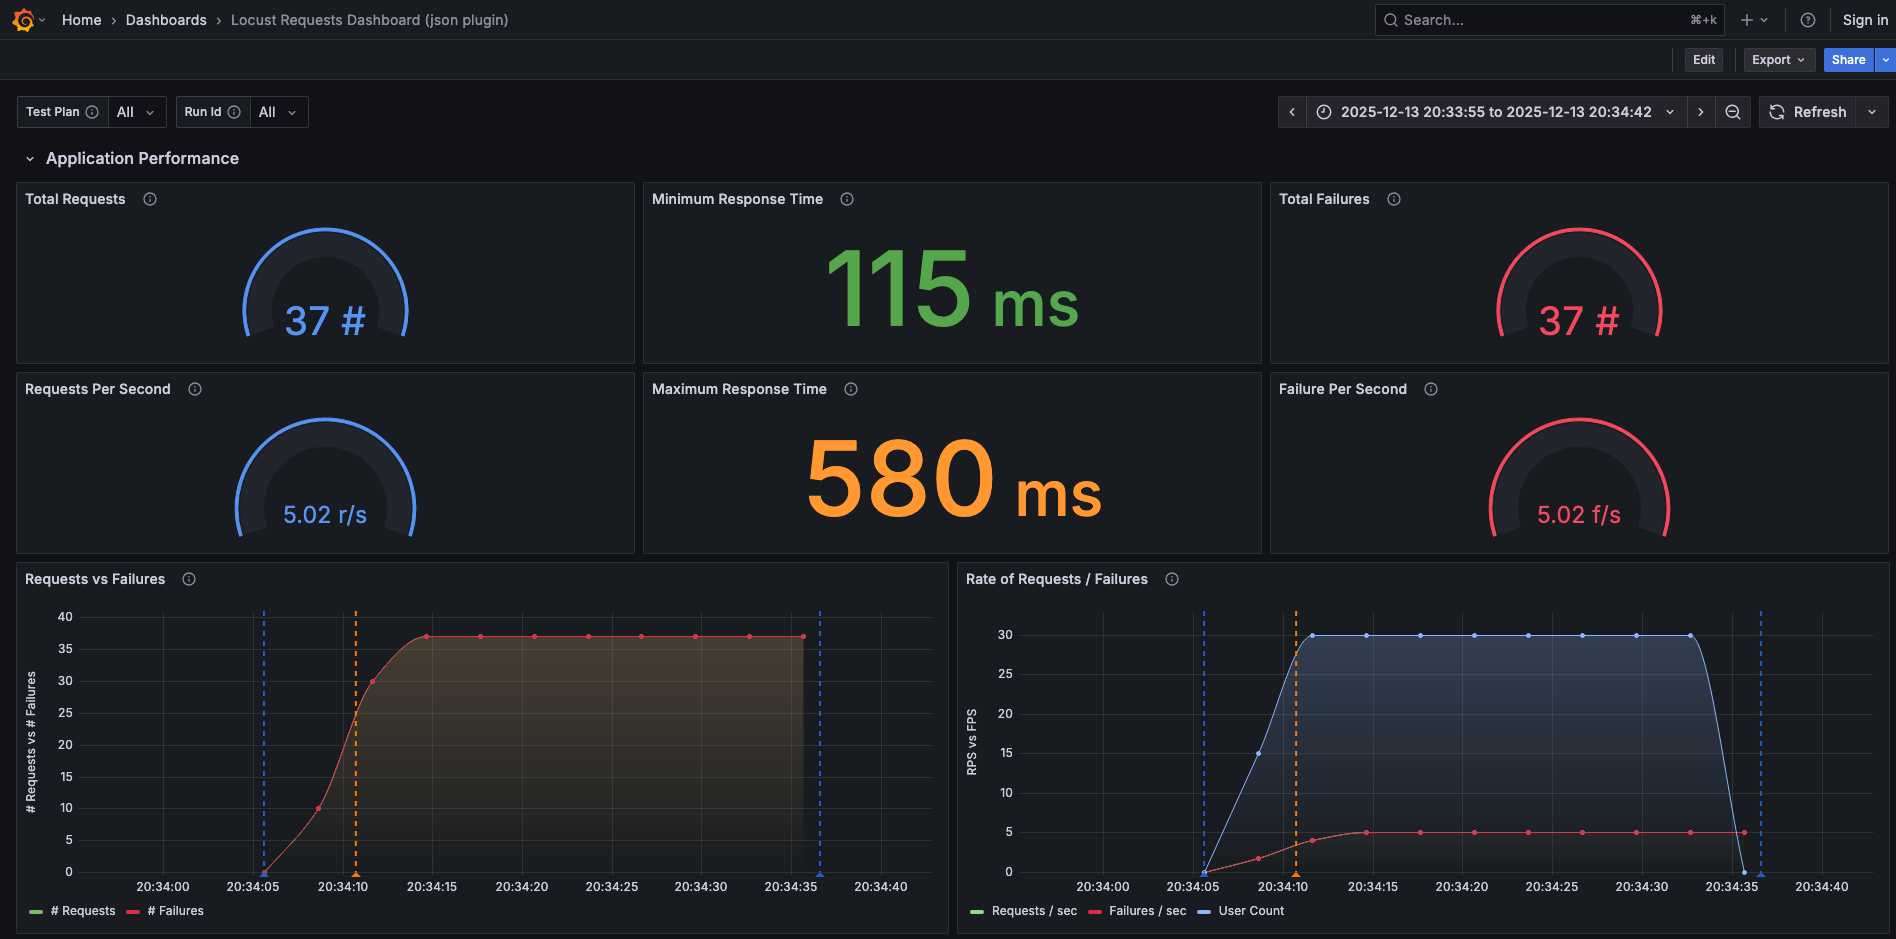
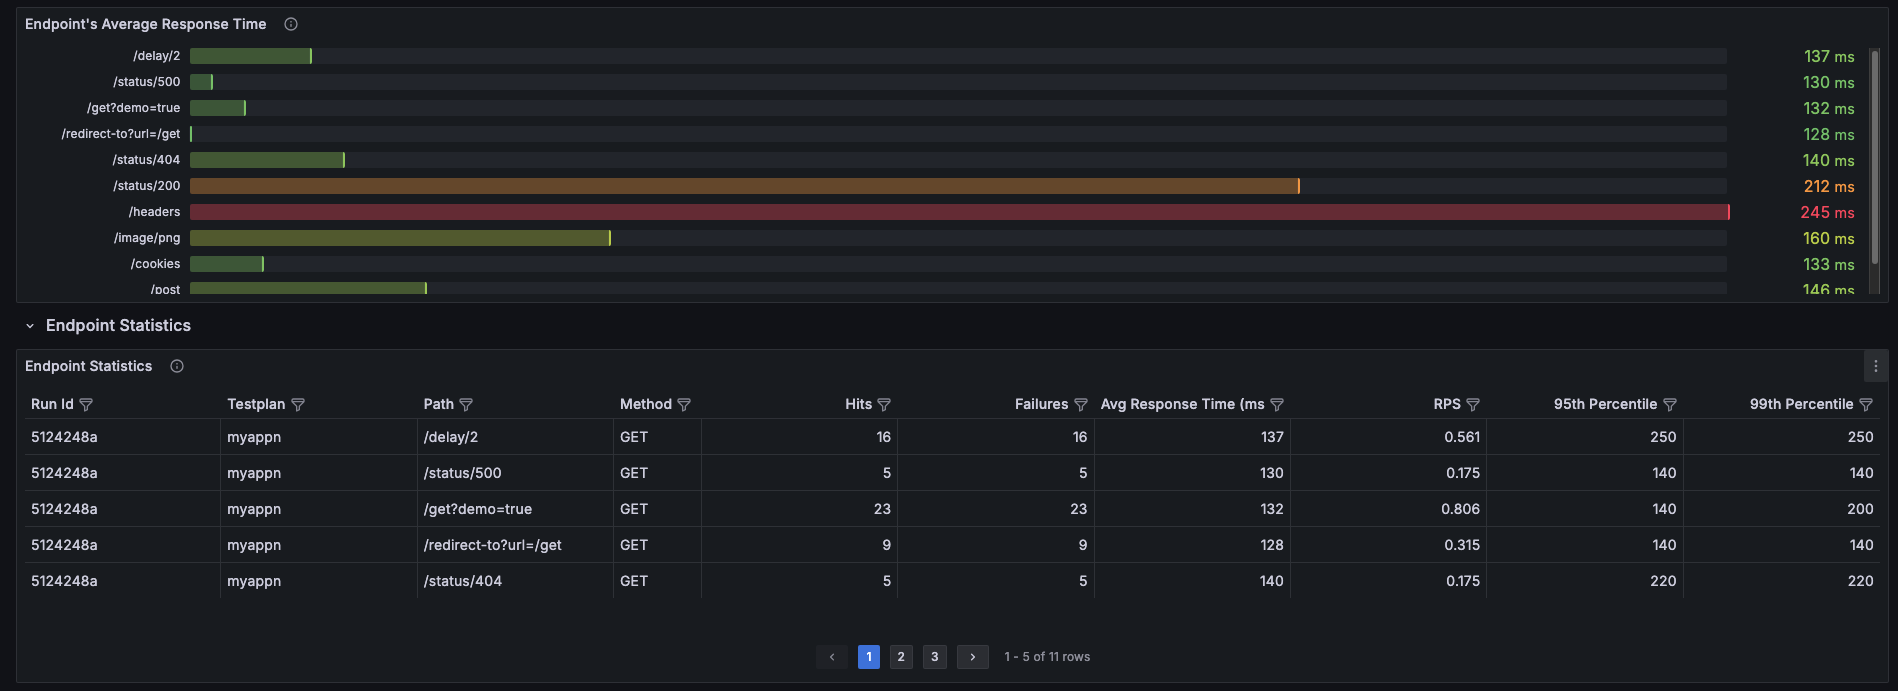
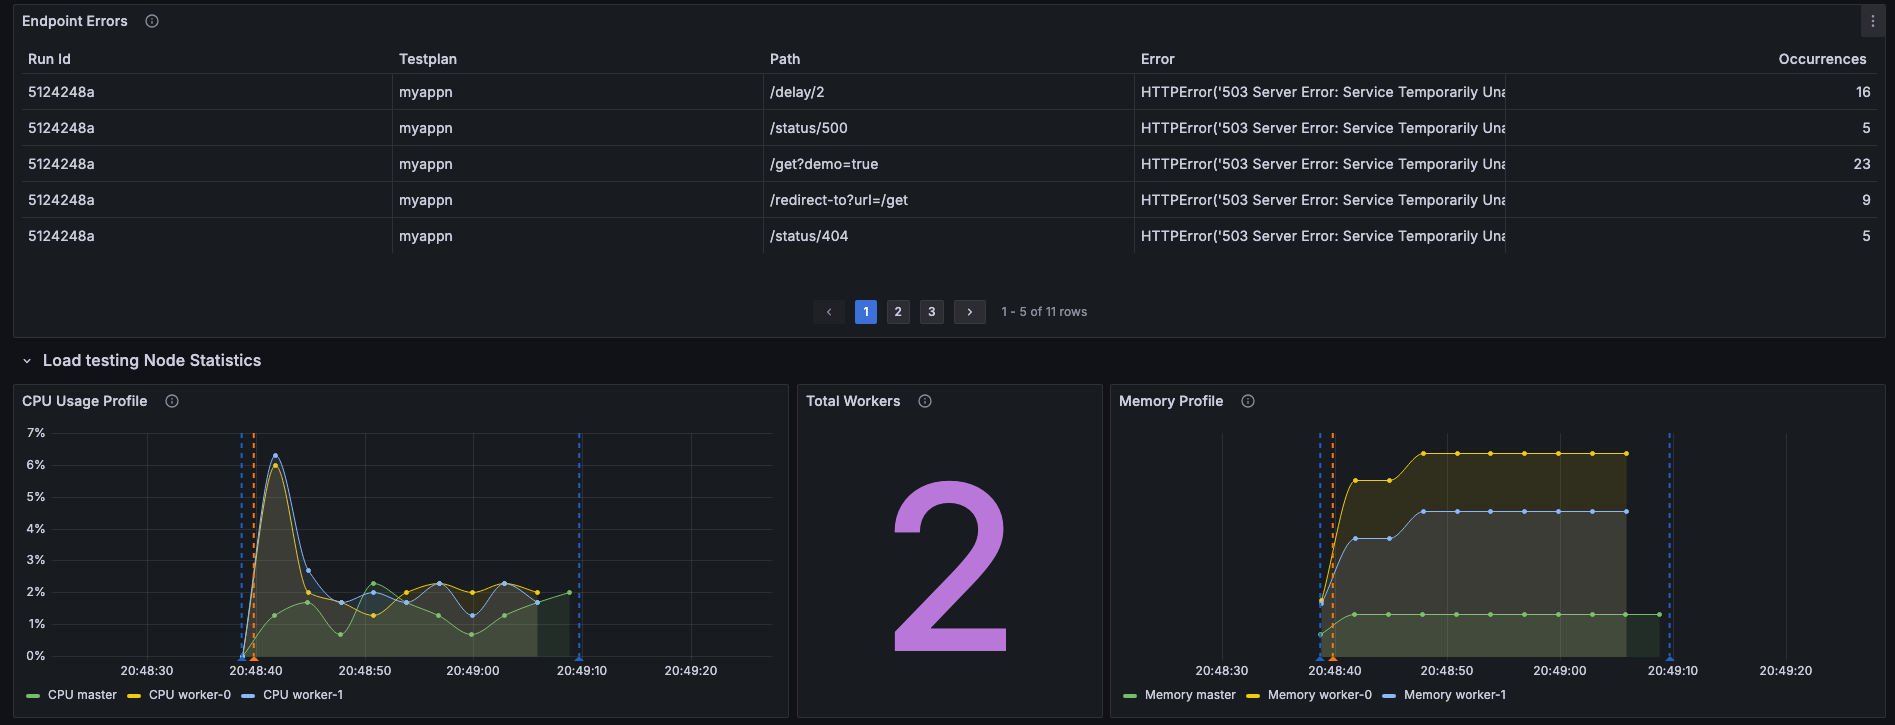
All the code examples are given in the GitHub Repository.
OpenTelemetry Metrics Recorder
The OpenTelemetry recorder exports Locust telemetry using the OpenTelemetry Metrics API and OTLP.
Metrics are collected by the OpenTelemetry Collector and exposed to Prometheus, then visualized in Grafana.
Recorder Configuration
Enable the OpenTelemetry recorder using:
Environment variable:
LOCUST_ENABLE_TELEMETRY_RECORDER=otelOr CLI flag:
--enable-telemetry-recorder otel
The OTLP exporter endpoint is configured via:
LOCUST_OTEL_EXPORTER_OTLP_ENDPOINTLOCUST_OTEL_EXPORTER_OTLP_INSECURE
Exported Metrics
The OpenTelemetry recorder emits:
Lifecycle events (counters)
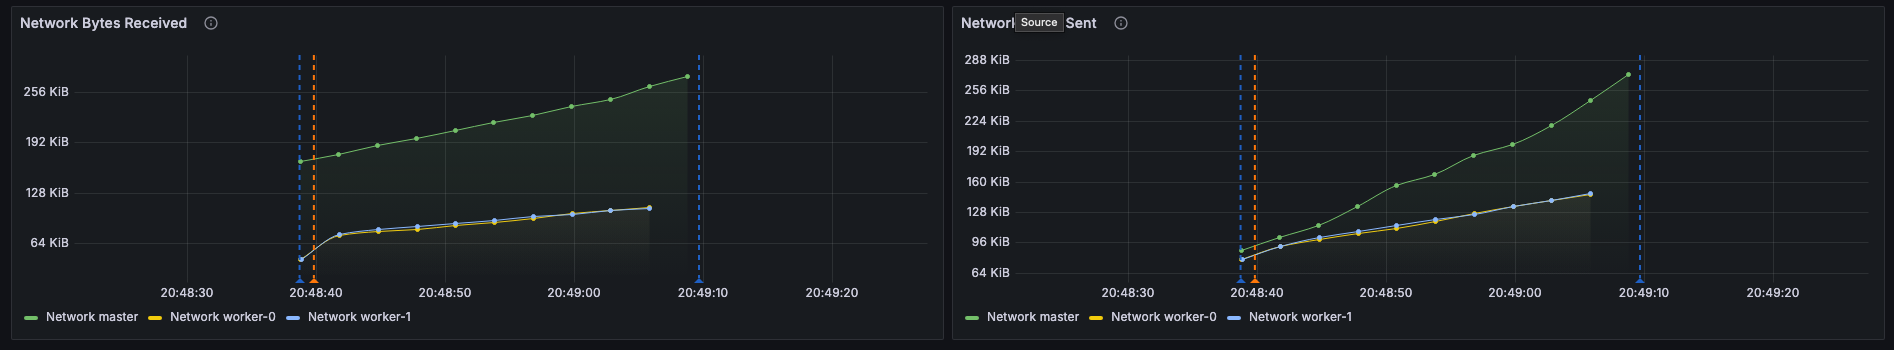
System metrics (CPU, memory, network)
Request metrics (latency histograms)
User metrics (active users)
Metrics are emitted from both master and worker nodes where applicable.
Sample Dashboards (OpenTelemetry)
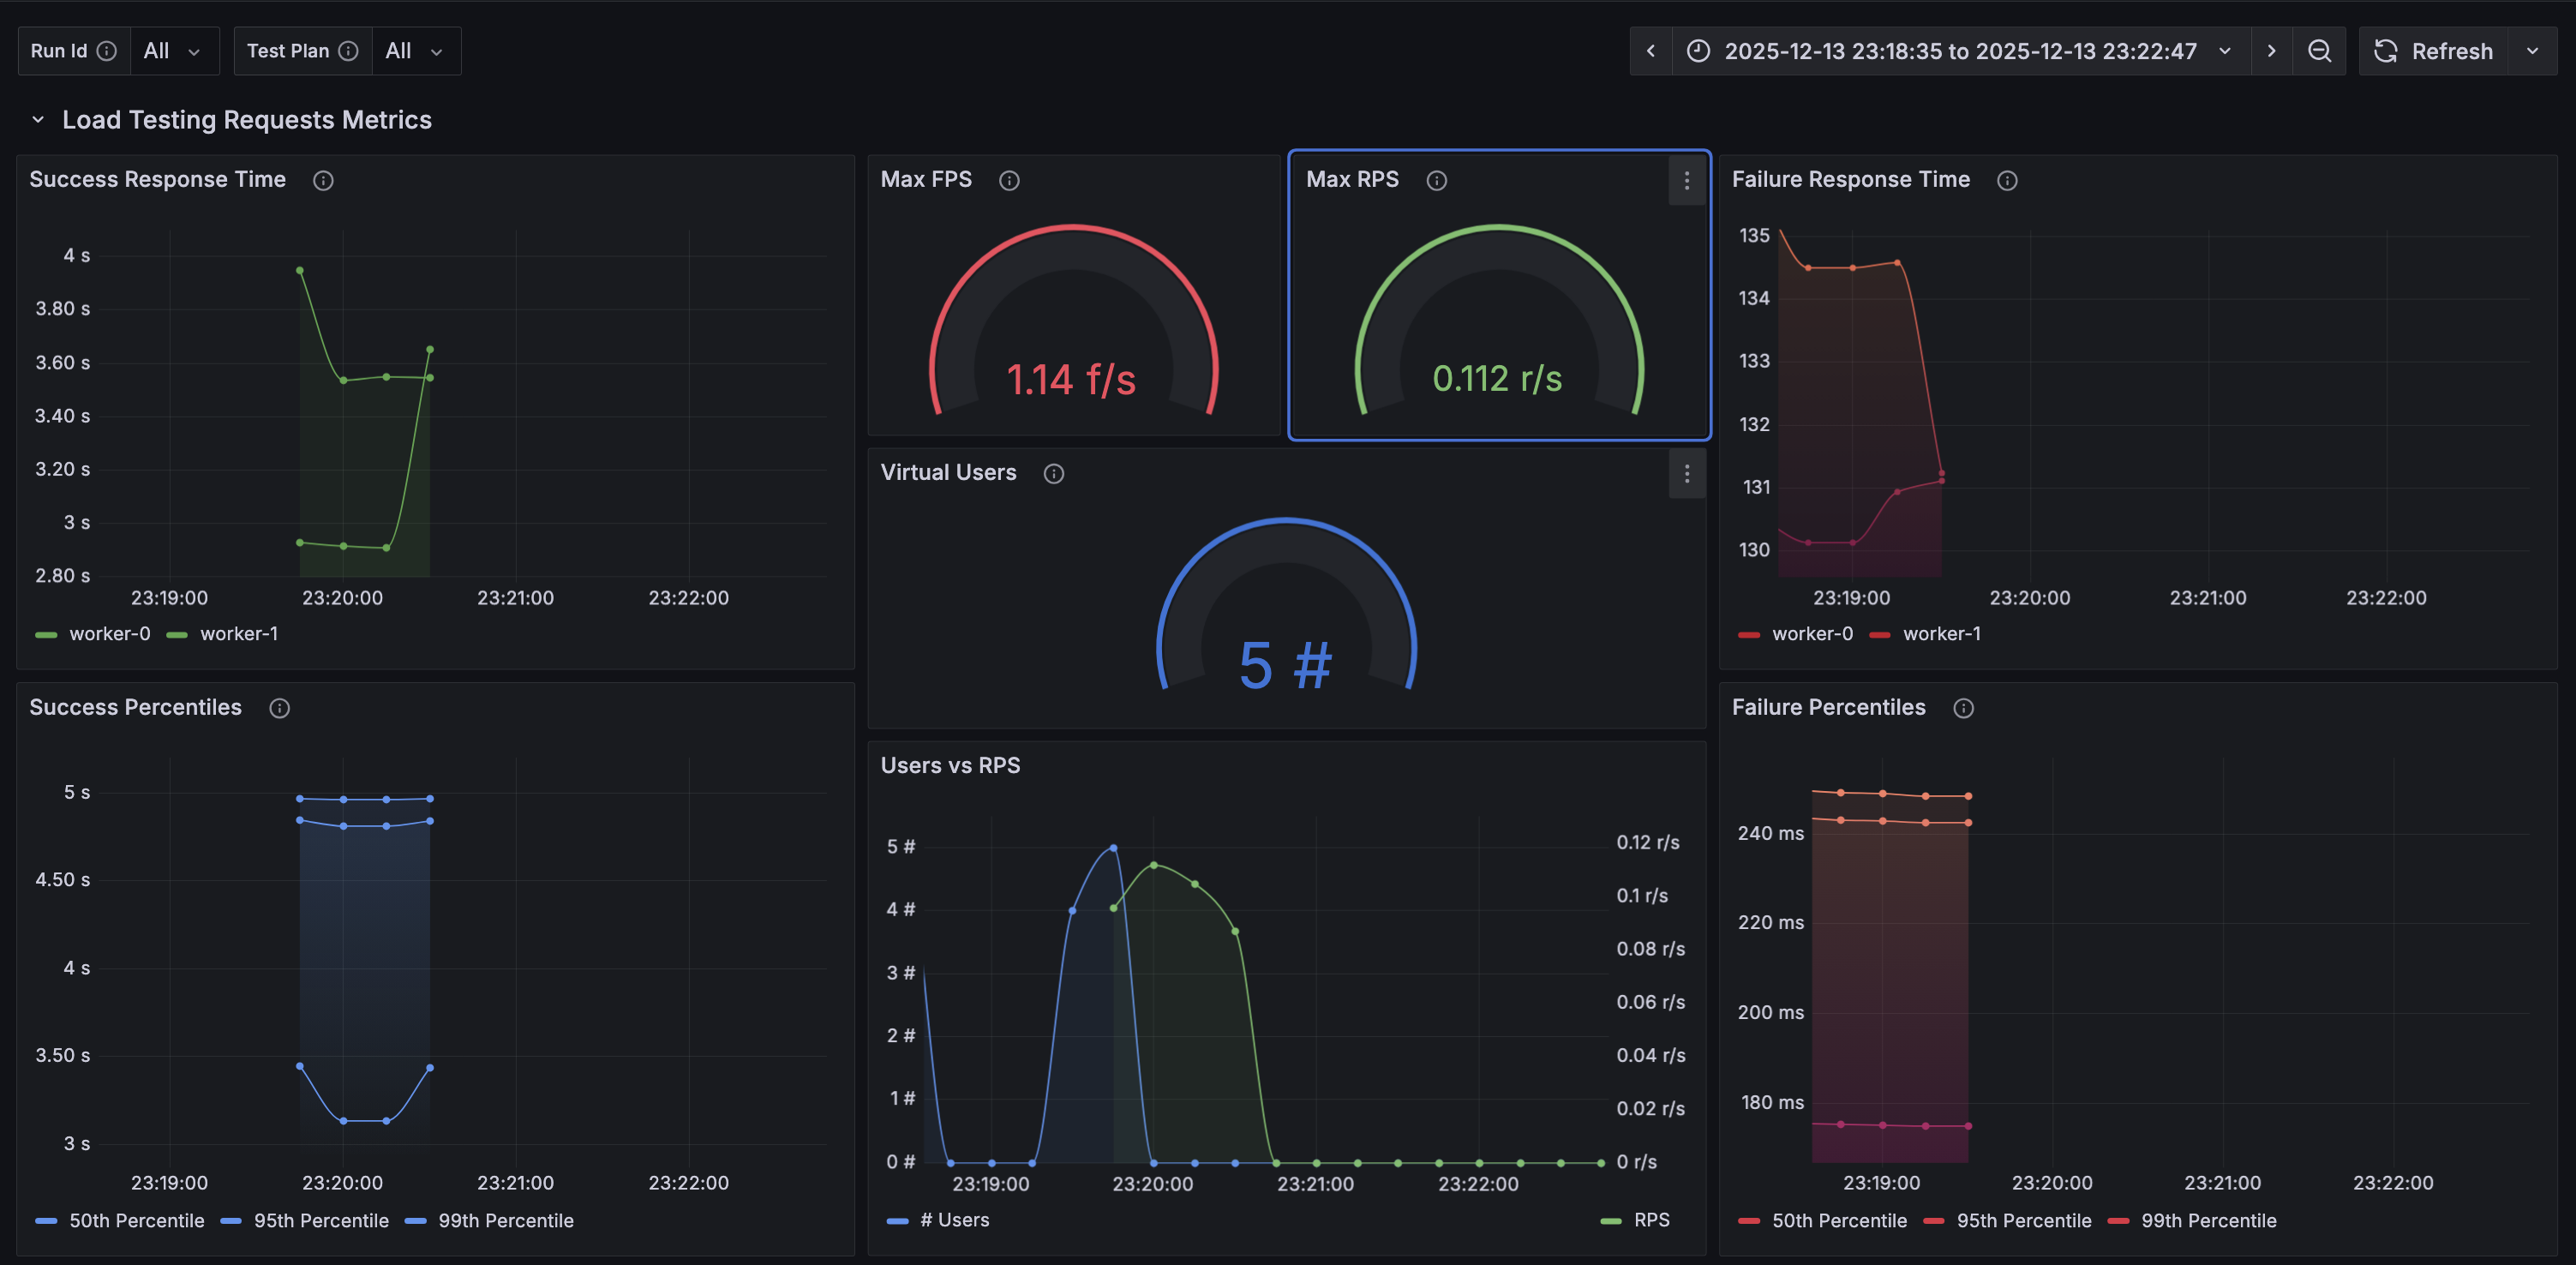
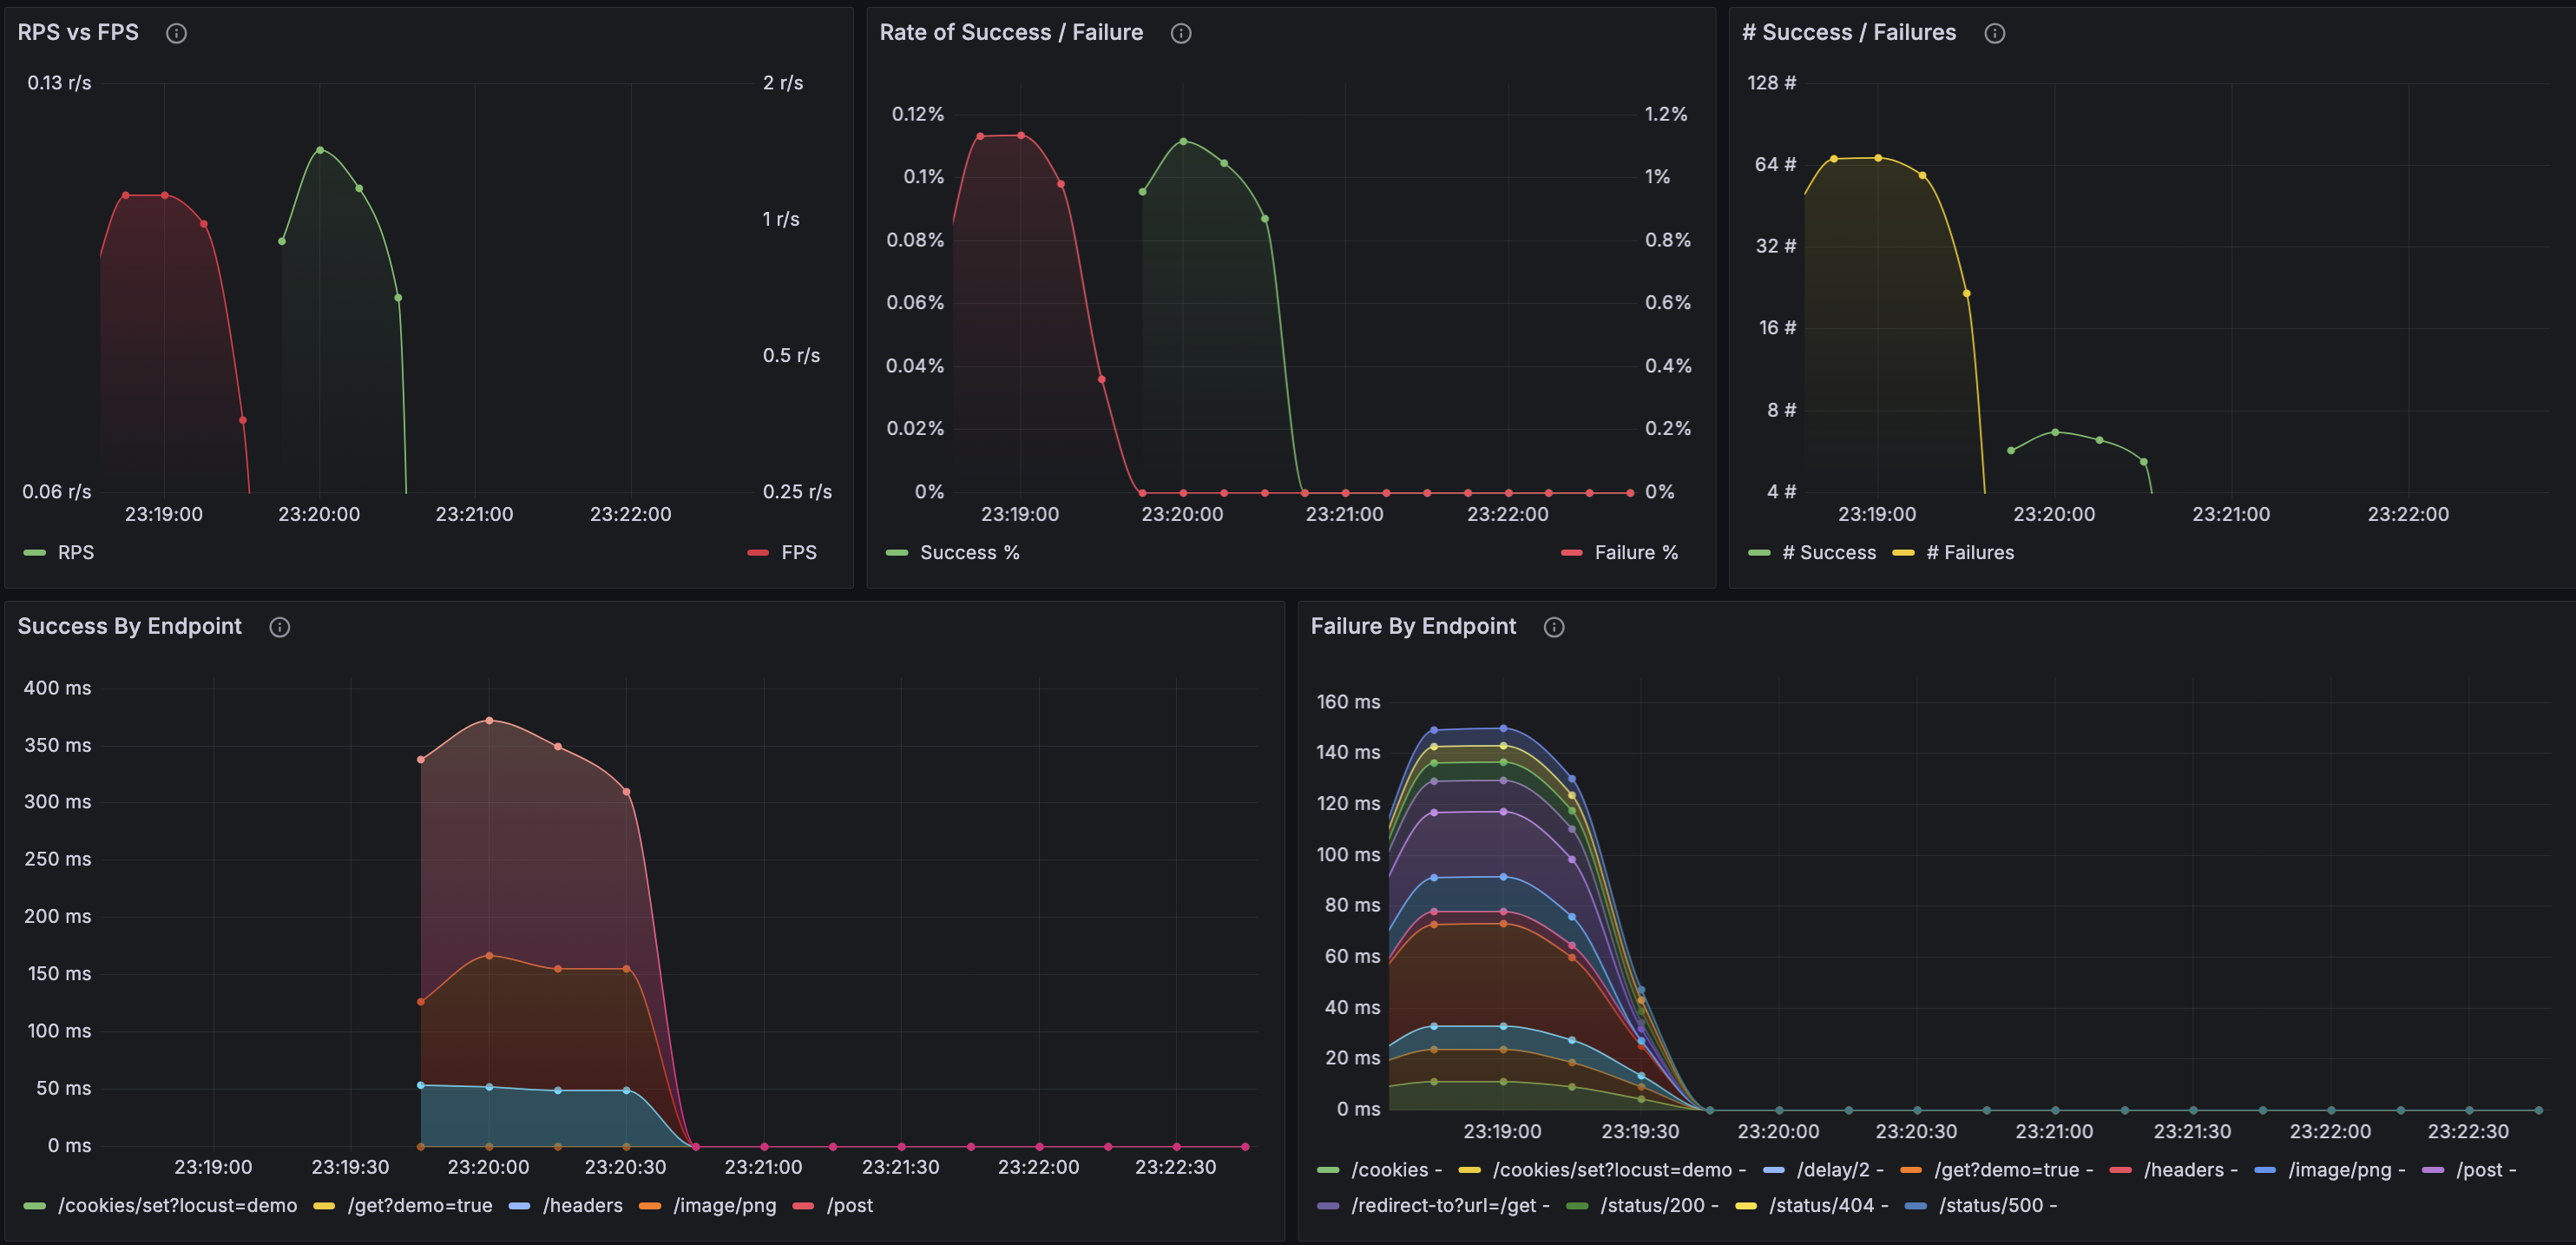
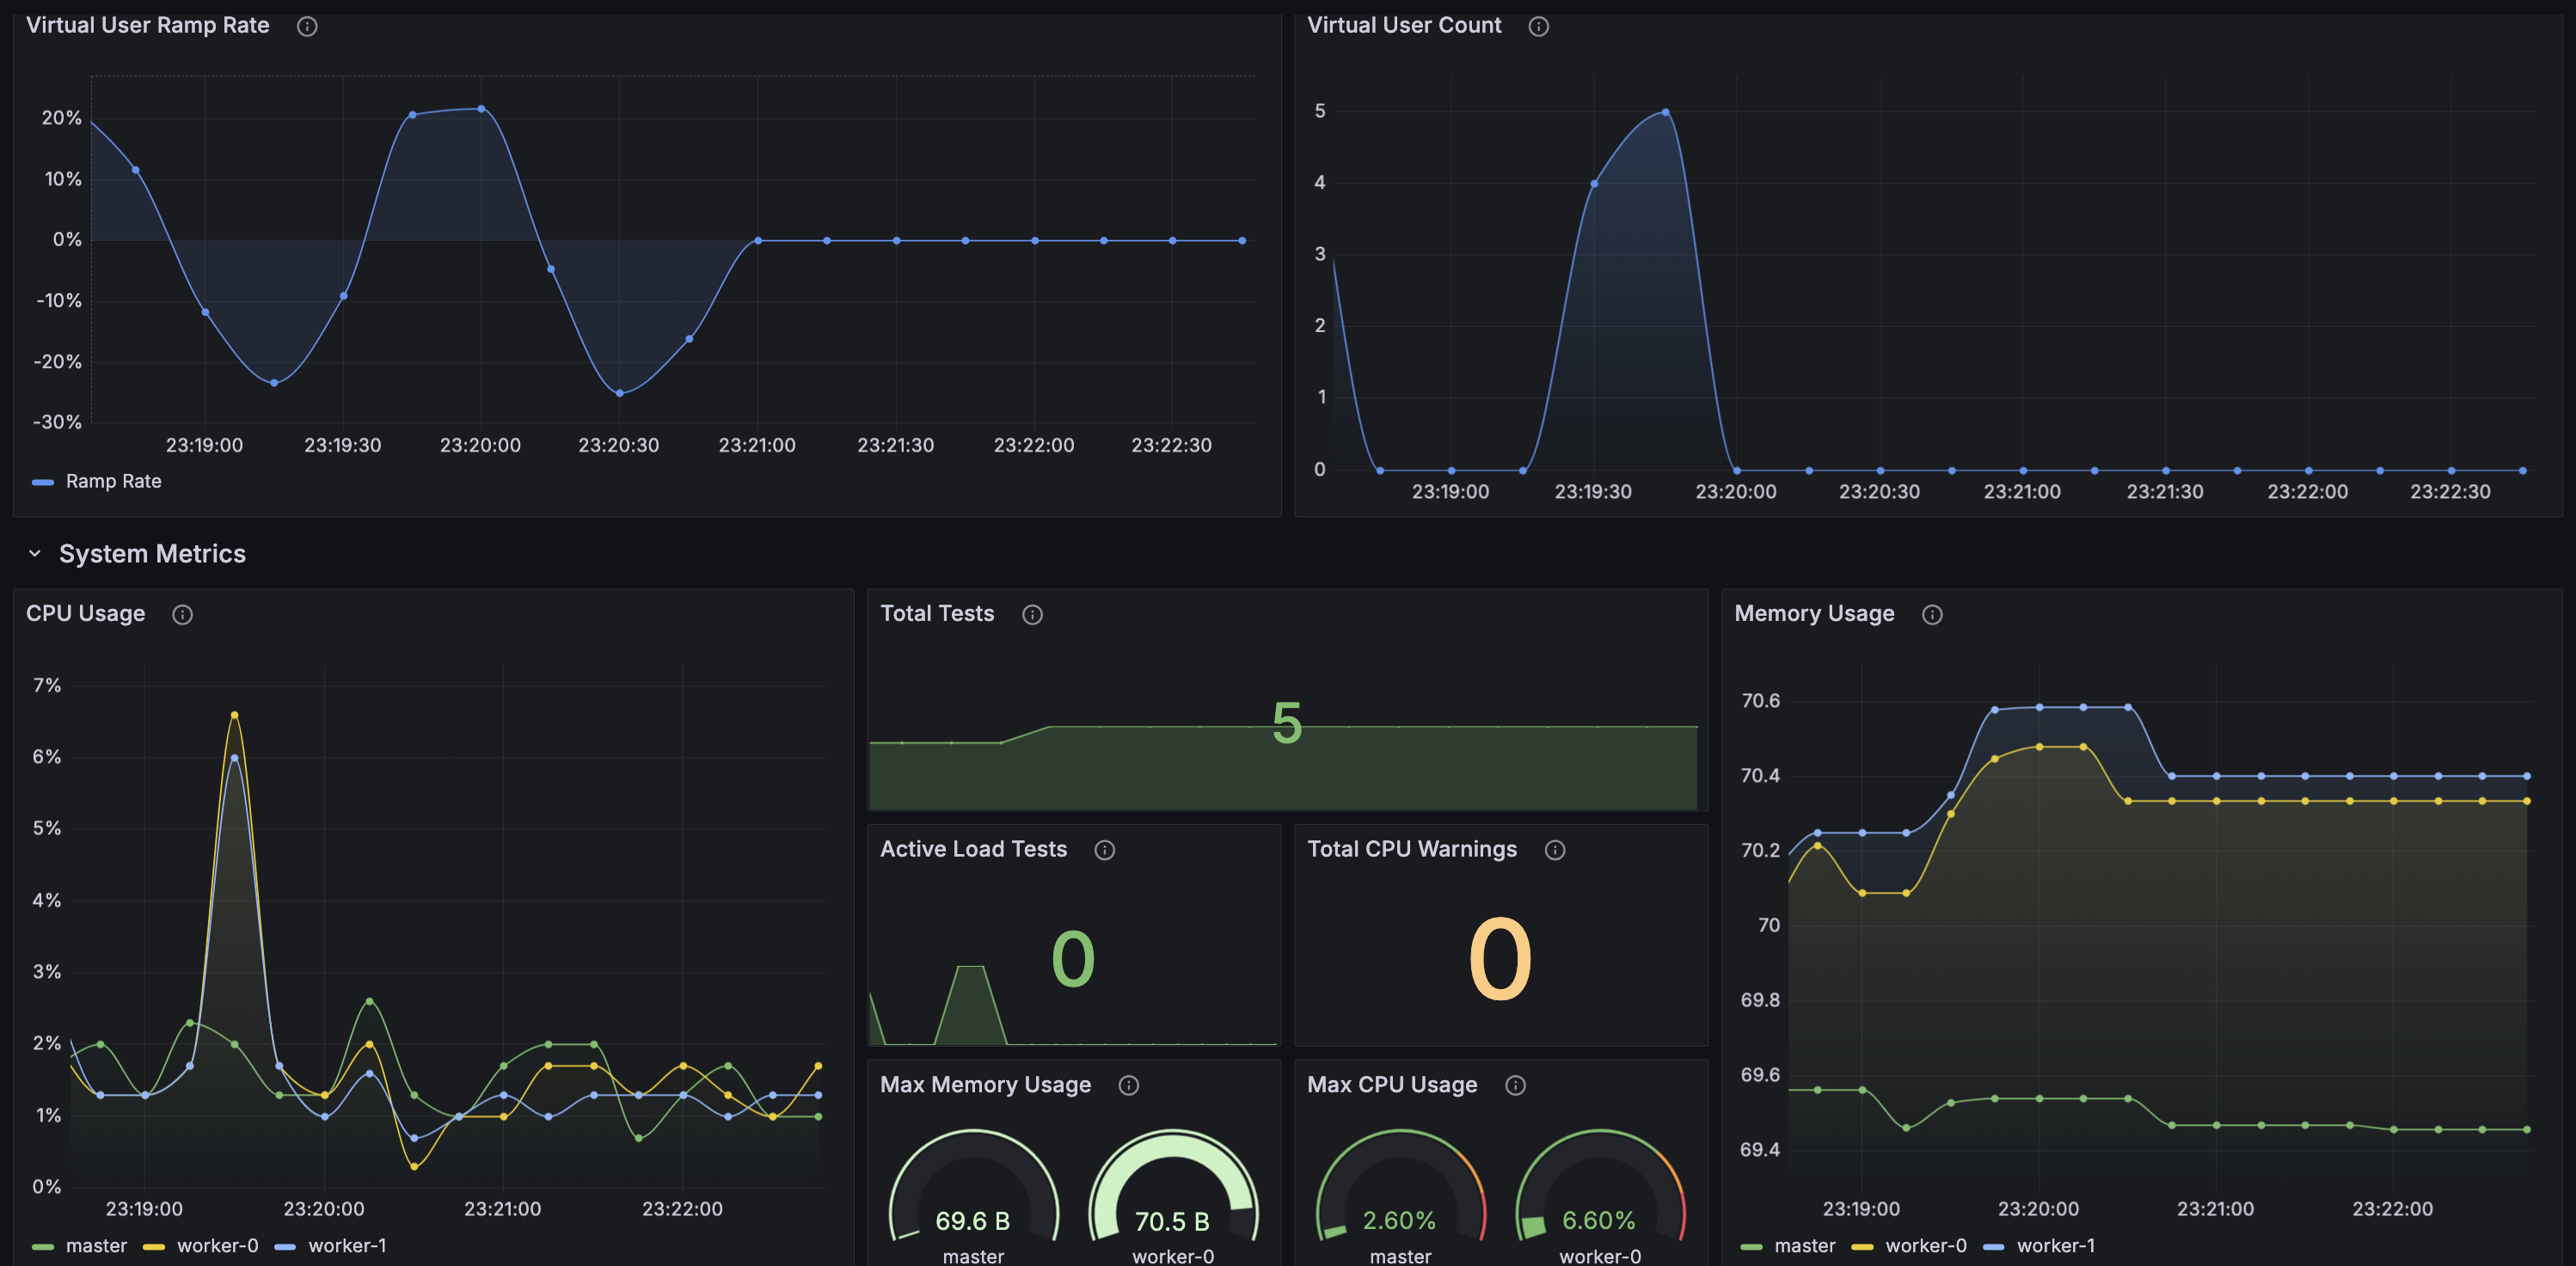
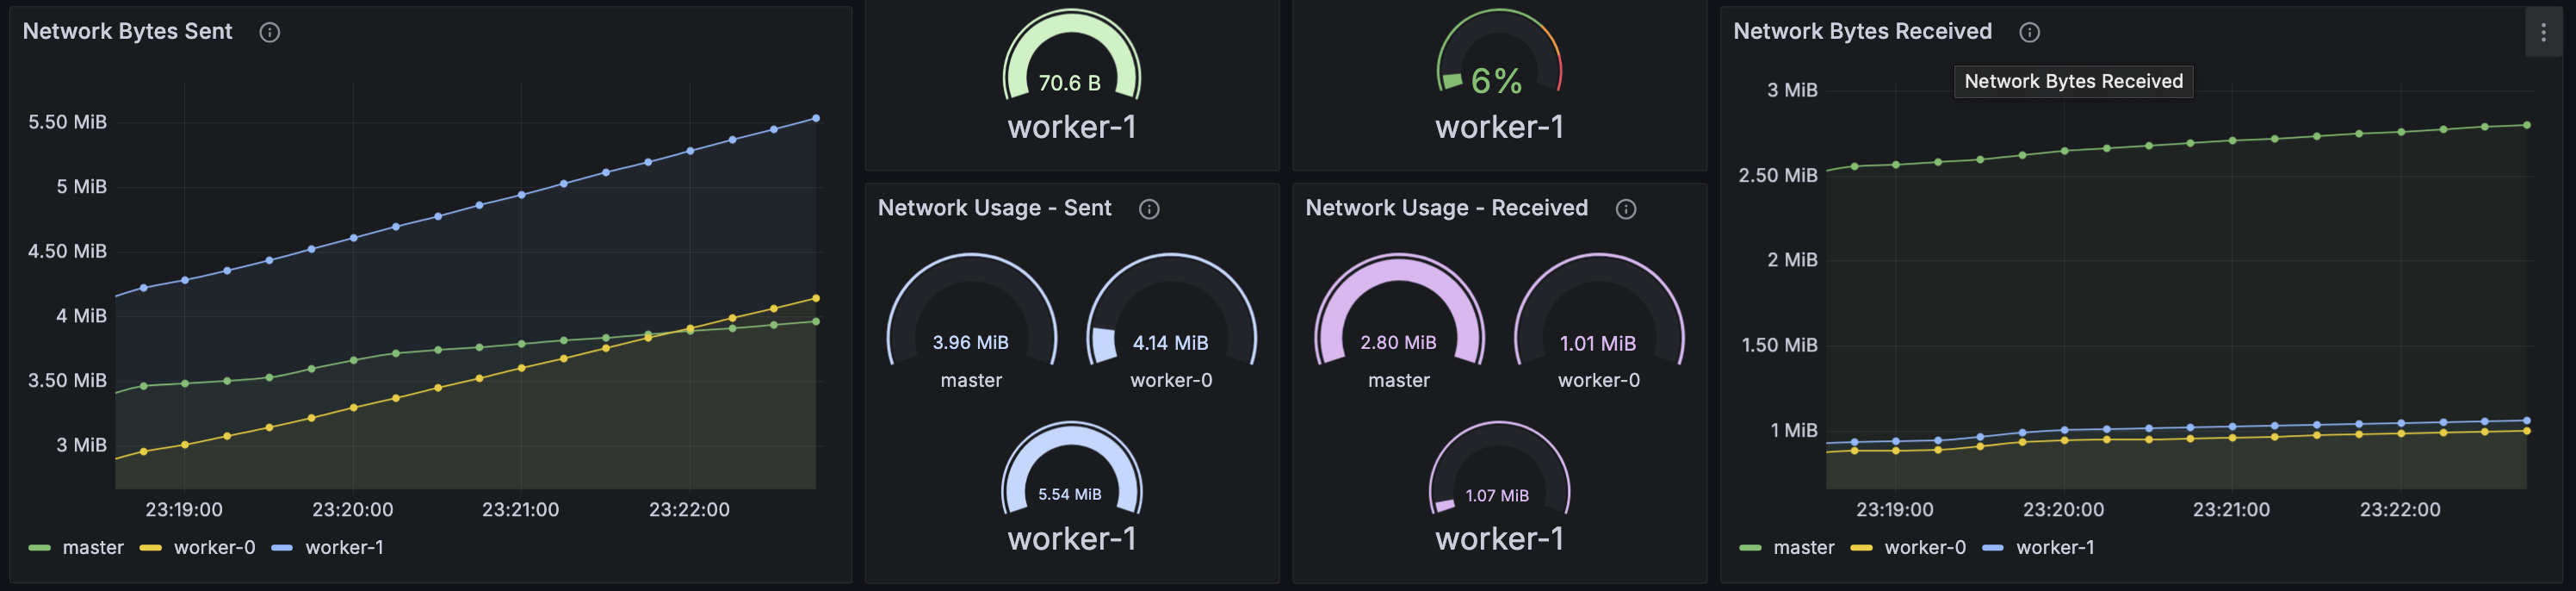
All the code examples are given in the GitHub Repository.